No separate login for your child
Link their existing account by email in seconds: nothing for them to approve, and your dashboard shows their real, live progress straight away.
Every child in one place
More than one child using BrightUp? Switch between them with a pill selector at the top of the dashboard, each one kept completely separate.
Same numbers your child sees
Streak, sessions and scores are read from the same stored data your child's own dashboard shows, never a separately-calculated, out-of-sync version.
What your child has done, and a real weekly check-in
This is exactly what the dashboard shows and exactly how each number is worked out, nothing simplified for this page.
Where your child is up to, not a forecast of exam day
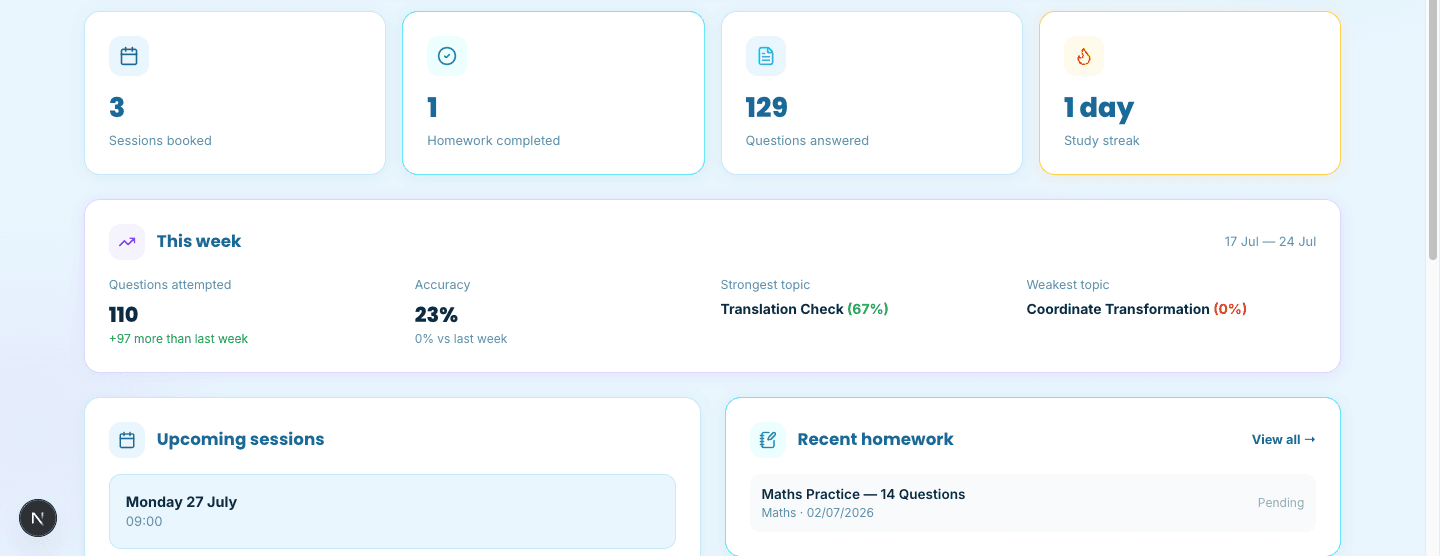
The first card names your child, their year group and the exam they're preparing for, with the date they were last active. Under it sit four counts: sessions booked, homework completed, questions answered, and their current study streak in days.
What you won't find is a score claiming to forecast how your child will do on the day. Judging how ready a child is for a particular school's exam is the work of the tutor teaching them, who knows the paper, the school and the child. An average of practice answers is not a substitute for that, so we don't dress one up as an outcome.
Where there's nothing to show yet, the dashboard says so plainly: "No activity yet", "No sessions booked yet", "No homework set yet", "No exam attempts yet". Nothing is estimated to fill the gap.
A real week-on-week check-in, not just a running total
Every week the dashboard shows questions attempted and accuracy for the last 7 days, directly compared against the 7 days before, so "+97 more than last week" or "+4% vs last week" always means exactly that, not a vague trend arrow.
Alongside it, this week's strongest and weakest topic are named directly. A topic only qualifies as the "weakest" once it has at least 3 attempts that week, so a single unlucky guess can't misrepresent a topic your child otherwise knows well.
Four live stats, and what's coming up next
Sessions booked, homework completed, questions answered and study streak sit at the top of every visit. Below them, three cards keep the recent picture in view.
A real dashboard, not a mockup
This is a screenshot from a real BrightUp parent account, cropped to the stats, showing exactly the tiles and cards described on this page. The figures are one test account's genuine numbers, not a designed example.
"View all" opens a full progress page per child
The dashboard is the daily snapshot: every homework and exam card links through to a dedicated page with the full history behind it.
Score trends by subject
A line chart of every practice and homework result over time, one line per subject, with a reference line at the 80% mark selective grammar schools typically use as a pass threshold.
2-week momentum per subject
Each subject is tagged Stable, or a real percentage change (e.g. "+6% in 2 weeks"), comparing the last 14 days of results against the 14 days before, only shown once there are at least 5 results in each window.
Topic performance heatmap
Every topic your child has practised, homework-attempted or been examined on, shown as a colour-coded circle sized by how many questions it's based on: bigger and greener means both well-practised and well-understood.
Personal bests
The single best score ever recorded for each subject or topic, with the date it was set, a running record of genuine high points, not just the most recent attempt.
Every row of the exam history on the full progress page opens a complete question-by-question review of that exam, with a topic breakdown of exactly where marks were gained or lost. Nothing is summarised away.
Frequently asked questions

Ready to see your own child's dashboard?
This page is the honest walkthrough: linking your child's account takes seconds once you're signed in.